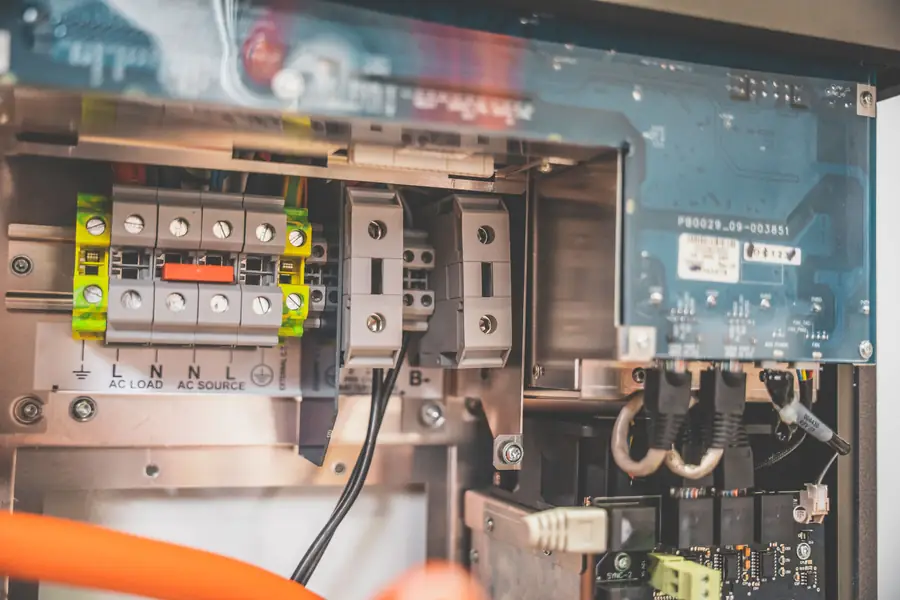
Plant monitoring
Know your plant's output
Generation, inverter status and fault alerts on your phone, with a monthly report, for plants in Punjab, Haryana, Himachal Pradesh and Chandigarh.
- Your plant, in your pocket.
- Generation draws as the day goes.
- If something fails, you hear about it.
- A technician restores it, and the curve recovers.
- Every month, a report you can keep.
What we watch on your plant
Four things, read from your inverter all day. Where an inverter does not report one, we say so instead of guessing.
-
Generation
Power now, energy today and the running total, shown as a curve you can read at a glance.
You see Power now, today and lifetime
-
Inverter status
Online, standby, offline or faulted, with the time it last reported.
You see Status and last report time
-
Faults
Fault codes, voltage and frequency limits, and temperature that keeps rising.
You see Alerts with the evidence behind them
-
String checks
Per-string readings, so one weak string stands out from the rest. Only where your inverter reports them.
You see Where the inverter supports it
Depends on your inverter
When something looks wrong, people know
An alert is a reason to look, not proof of a failed part. Our team checks the evidence first, then acts.
What raises an alert
- Inverter offline No reading for longer than the agreed gap
- Fault code The inverter reports a fault
- Limits crossed Voltage, frequency or temperature outside the range set for your site
- Temperature keeps rising Three readings in a row, each warmer than the last
Who hears about it
-
Our service team
Sees every alert, checks the evidence and decides whether to call, fix remotely or send a technician.
-
You
See the alerts that matter to you in your client portal. Message alerts to your phone are set up when your plant is connected.
-
A technician
An alert can become a service ticket, so the visit, the fix and the note all stay on one record.
A monthly report you can keep
One page a month for your records, your bank or your installer, with the facts about your own plant.
- Generation for the month, day by day
- Faults and downtime, with dates
- Cleaning visits and photos
- Service visits and what changed
- What we suggest next
- Generation
- 612 kWh
- Alerts
- 1, inverter offline 40 min
- Cleaning visits
- 1
Keep the inverter you have
We read your plant through the portal or logger your inverter already uses. Nothing to rip out.
- Your inverter
- The inverter's own cloud portal or data logger
- Our connector, with your permission
- Your dashboard and monthly report
- Most grid-tie inverters send their data to a cloud portal or a data logger. We read from that, so you keep the inverter you have.
- We need an authorised data feed from that portal or logger. We confirm yours works before you commit.
- If your inverter offers no feed, we can still log monthly readings by hand on a Care visit.
Your plant data is yours
Generation readings show when a home is empty and when a factory runs. We treat them that way. Read the privacy policy.
Book site survey- Your plant data is used to run your service and prepare your reports.
- We do not sell it or share it with other installers.
- You give the access to your inverter portal, and you can take it away at any time.
- Only people who work on your plant see it, and they see it inside our service system.

Connect your inverter.
Tell us the inverter make. We check whether its cloud portal can feed your phone with alerts and a monthly report.
Jalandhar Bypass, Ludhiana 141088 info@wesicsenergies.com